
At a glance: Vietnam’s trade balance swung to a deficit of $15.36 billion in H1 2026 – a sharp reversal from a $7.6 billion surplus in the same period last year. The headline number looks alarming, but the composition of imports tells a different story: manufacturers are frontloading production inputs – electronics components (+50.5%), machinery (+22.6%), and energy – ahead of anticipated H2 export orders. The Ministry of Finance has confirmed this is a demand-driven import surge, not a structural deterioration. The one genuine risk worth watching is inflation, which hit 5.6% in May, above the government’s 4.5% full-year target.
(vs. +$7.6B surplus H1 2025)
5 months 2026
January–May 2026
A Deficit That Looks Alarming – Until You Read the Fine Print
Vietnam’s Ministry of Finance confirmed at its Q2 press conference on June 17, 2026 that the country’s trade balance has swung to a deficit of approximately $15.36 billion in the first half of 2026 — a sharp reversal from the $7.6 billion surplus recorded in the same period last year. On the surface, the number looks like a warning sign. In context, it tells a different story.
Deputy Minister Nguyen Duc Chi attributed the deficit primarily to higher prices for fuel imports as a result of the war in the Middle East — and expressed confidence that export growth will accelerate during the rest of the year, narrowing the trade deficit for the full year.

What’s Actually Being Imported — and Why
Vietnam recorded a trade deficit of $5.21 billion in May 2026 alone — the largest monthly trade deficit since records began in 1990. Exports grew 18.0% year-on-year to a record $46.93 billion, while imports rose at a faster pace of 33.8% to a record high of $52.14 billion. But the composition of imports tells the real story.
“The deficit was caused by higher prices for fuel imports as a result of the war in the Middle East. I believe that export growth will accelerate during the rest of this year, narrowing the trade deficit for the entire year.”
— Deputy Minister Nguyen Duc Chi, Ministry of Finance, June 17, 2026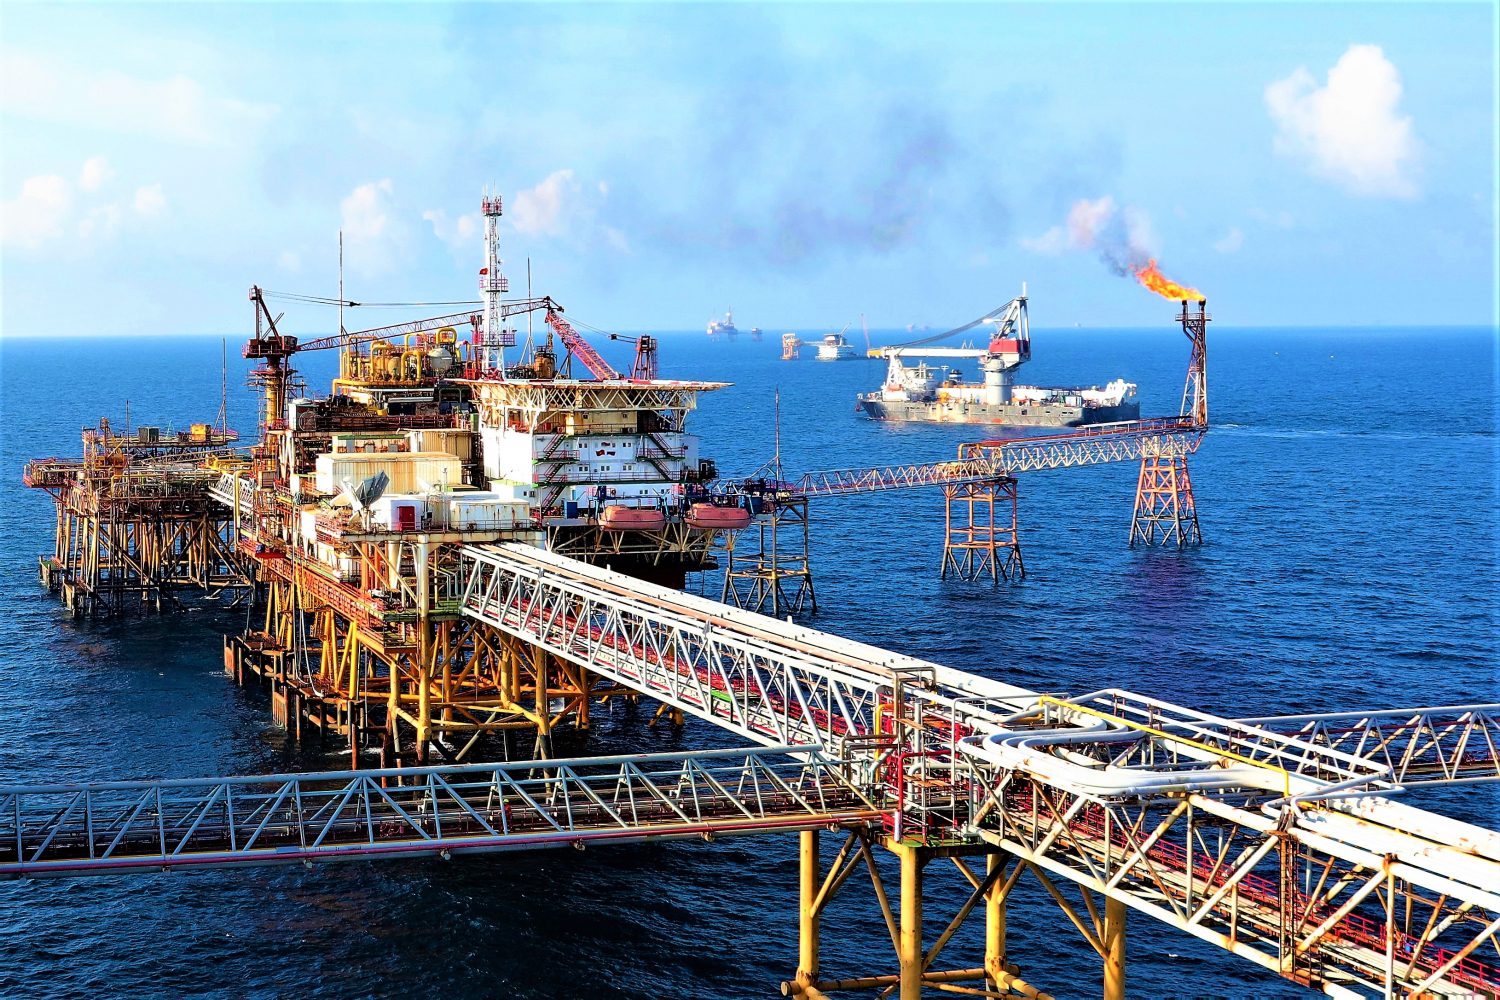
The Structural Picture: Surplus Where It Matters
Vietnam maintains a large trade surplus with the United States ($33.9 billion) and the EU ($10.6 billion), but runs a high trade deficit with China ($33.3 billion), South Korea ($10.6 billion), and ASEAN ($5.0 billion). This pattern is not new — and it reflects Vietnam’s role as an assembly and export hub that imports components and raw materials from regional suppliers, then ships finished goods to Western markets.
| Market | Trade balance Q1 2026 | Direction |
|---|---|---|
| United States | +$33.9B surplus | Vietnam exports finished goods |
| European Union | +$10.6B surplus | Vietnam exports finished goods |
| China | −$33.3B deficit | Vietnam imports components/inputs |
| South Korea | −$10.6B deficit | Vietnam imports components/inputs |
| ASEAN | −$5.0B deficit | Vietnam imports raw materials/energy |
Higher fuel costs have put additional inflationary pressure on the economy. The annual inflation rate came in at 5.6% in May, higher than the government’s full-year target of 4.5%. With the Hormuz strait only beginning to reopen and oil price normalization likely to take months, fuel cost pressures may persist into Q3 — affecting not just energy imports but transport costs across the domestic supply chain.
What This Means for Logistics and Supply Chain
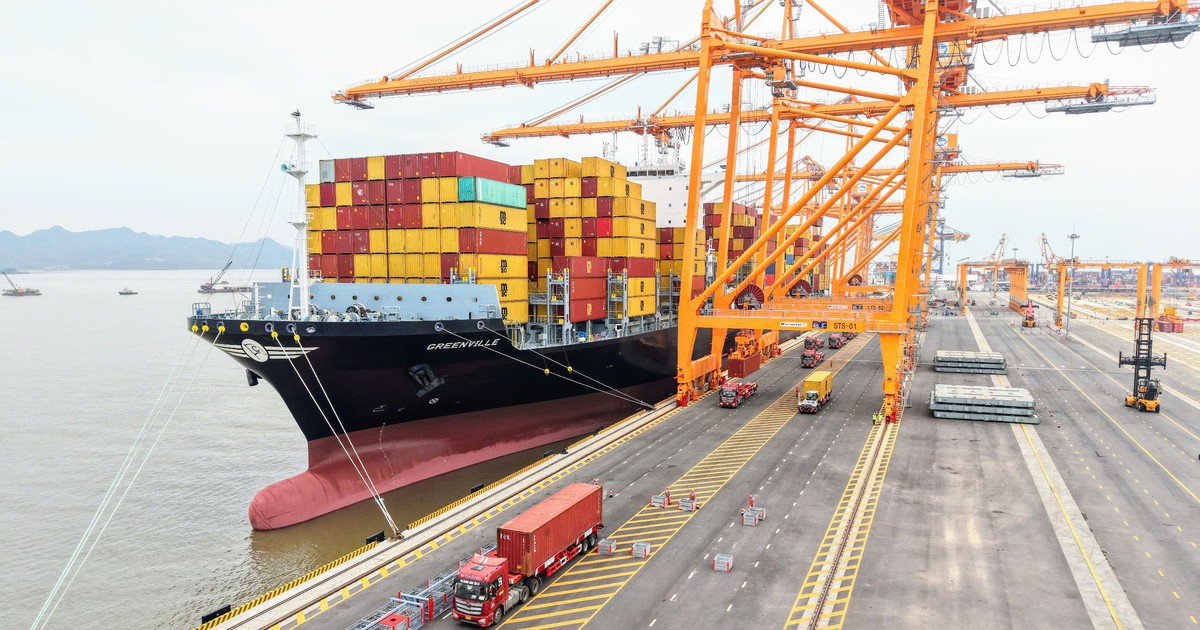
The import surge — particularly in electronics components (+50.5%) and machinery (+22.6%) — signals that manufacturers are actively ramping up production capacity ahead of anticipated H2 export orders. For logistics operators, this translates to sustained high import volumes in the near term, followed by what should be an equally strong export push in Q3 and Q4.
The frontloading dynamic is compounded by the broader trade policy environment: with Section 301 tariff deadlines approaching in July and the Section 122 framework expiring on July 24, many exporters are also pushing to get goods to U.S. ports ahead of potential rate changes — adding further pressure to already-tight transpacific capacity.
What Businesses Should Monitor
-
1Book export capacity early for Q3With import volumes signaling a production ramp-up, export capacity from Vietnam — already strained — is likely to tighten further as finished goods move out in Q3. Early booking on key lanes (US East Coast, EU) is advisable.
-
2Monitor fuel cost pass-throughThe Hormuz reopening will normalize oil prices over time — but not immediately. Track BAF (Bunker Adjustment Factor) movements on your key trade lanes, as carriers will adjust surcharges as fuel costs evolve.
-
3Watch the July 24 tariff transitionThe Section 122 → Section 301 tariff transition creates a hard deadline for U.S.-bound cargo. Coordinate with your freight forwarder to ensure shipments arrive at U.S. ports before July 24 if cost exposure is significant.
-
4Assess domestic logistics cost exposureWith inflation at 5.6% — above the government’s 4.5% target — domestic transport, warehousing, and labor costs are all subject to upward pressure. Factor this into landed cost calculations for H2 planning.
Looking Ahead
Vietnam’s $15 billion trade deficit is not a structural crisis — it is the predictable outcome of a manufacturing economy frontloading production inputs ahead of a strong export cycle, compounded by an energy price shock from the Middle East. The more meaningful numbers to watch are Q3 export volumes and whether inflation can be contained as fuel costs normalize.
Voltrans Logistics will continue to monitor Vietnam’s trade data and publish updates as Q2 final figures are confirmed. For questions about freight capacity planning, cost modeling, or supply chain logistics for H2 2026, our advisory team is available to assist.